
The European Network Against Racism (ENAR) used Tableau visualizations to highlight migrant plights.
The non-profit European Network Against Racism (ENAR) compiles annual reports based on information and data collected by member organisations. These reports are based on many sources of data, official, unofficial, academic and experiential. These allow access to information, provides the perspective of those directly affected by racism. ENAR was looking for a more impactful and effective story telling platform to capture the realities of racism in EU member countries.
A non-profit perspective on migration
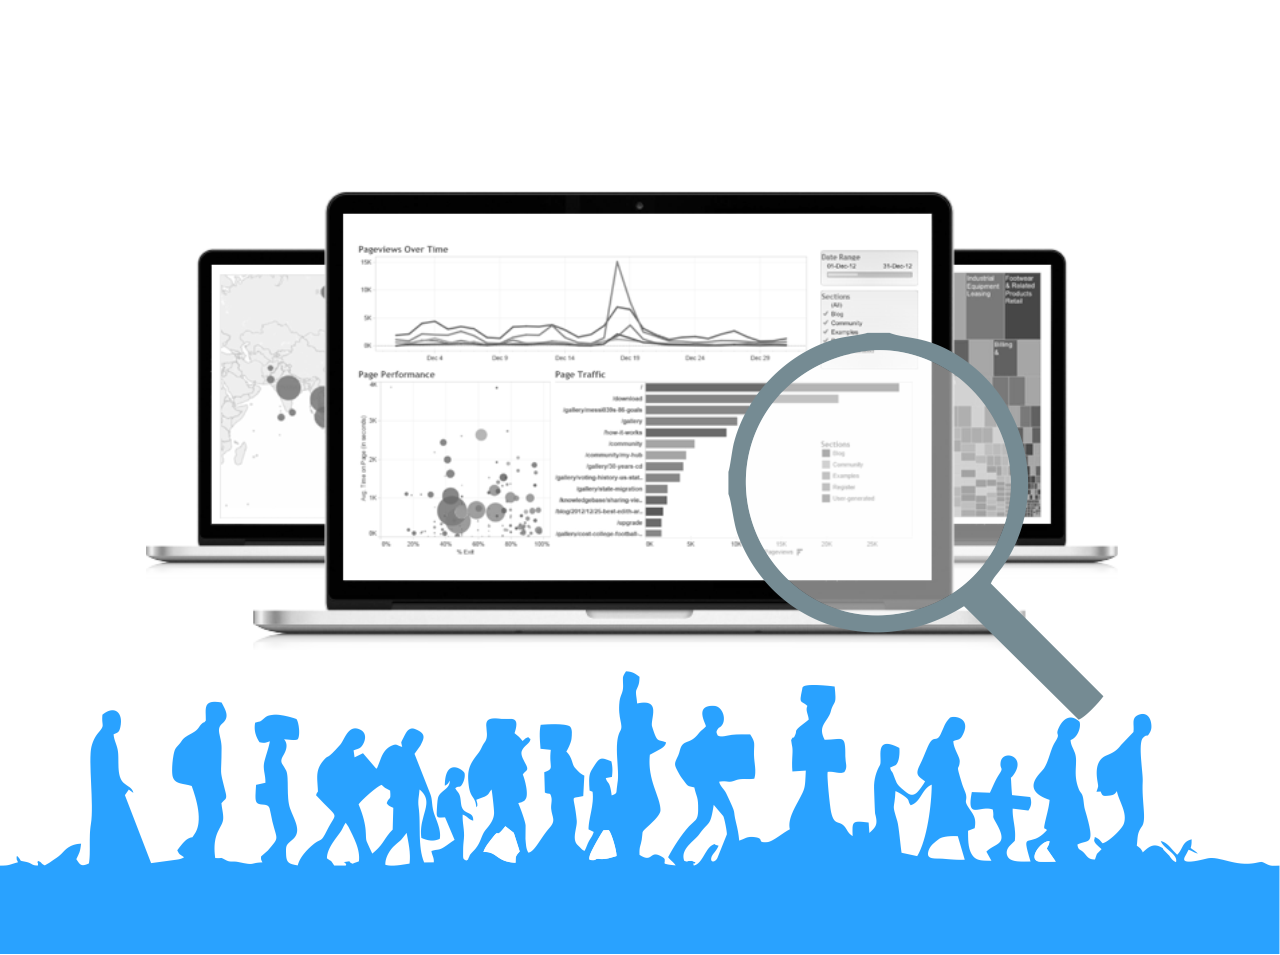
The dashboard is a tableau based representation of the those who either are or work directly with those affected by racism.
- The rise of far-right parties using racist/xenophobic idea and policies
- Discrimination, labour market access leading to lower employment rates
- Rise in racially motivated crimes across EU member states
The dashboard highlights some of the key findings on racism and discrimination in the context of racism and discrimination against migrants.
Multiple Countries. Multiple sources.
Racism is an everyday reality for many ethnic and religious minorities in the EU. The extent and manifestations of this is often unknown and undocumented, especially in official data sources. There are variations in the data being reported officially and those collected by the civil society organizations. The objective of ENAR is to highlight the racist structures and practices across member states and address them.
ENAR collects data for 24 member states. The form and reporting of these crimes have huge variations across member states. Data and statistics on prosecutions are hard to collect and often not publicly available, therefore it becomes difficult for them to offer a EU wide perspective.
Due to the variety of audience accessing the report, ENAR was looking for a visual reporting of the issues.
Perspective of those affected by racism
The dashboard on reporting racism and highlighting migrant issues helps ENAR convey their findings in an intuitive, easy to understand visual form.
With Tableau dashboards, ENAR is able to:
a. Integrate the visualizations on their website
b. Download, attach and share visuals in reports
c. Interactive and appealing visualizations generating better engagement
d. Responsive and mobile friendly
e. Faster conceptualization and implementation
ENAR is able to highlight bias and under-reporting of crimes motivated by racism more effectively.